| ECG Issue |
Characteristics on ECG |
Clinical Significance |
| Lead Arm Reversal |
- Leads I and aVF show inverted or abnormal patterns.
- Lead I appears as if inverted with a negative P wave, QRS, and T wave.
- Leads aVR and aVL may also show atypical patterns.
|
- Can lead to misinterpretation of axis deviation or infarction.
- May result in unnecessary or inappropriate clinical decisions if misdiagnosed as a pathological finding.
|
| Calibration at x2 |
- QRS complexes and waves appear twice as large as normal amplitude.
- Standard 10 mm/mV amplitude is doubled to 20 mm/mV.
|
- Can lead to false suspicion of ventricular hypertrophy or high voltage QRS complexes.
- Important to verify calibration settings before interpreting ECG findings.
|
| Calibration at x0.5 |
- QRS complexes and waves appear half the normal amplitude.
- Standard 10 mm/mV amplitude is reduced to 5 mm/mV.
|
- Can lead to underestimation of wave amplitudes, possibly missing signs of hypertrophy or other conditions.
- Important to verify calibration settings to avoid misinterpretation.
|
| Right and Left Arm Lead Reversal |
- Inverted P waves, QRS complexes, and T waves in Lead I.
- Leads aVR and aVL show reversed patterns (aVR may look more like normal Lead I).
|
- May be misinterpreted as dextrocardia or other pathological conditions.
- Can result in inaccurate clinical assessment if not recognized.
|
| Incorrect Chest Lead Placement (e.g., V1-V2 too high) |
- Abnormal R wave progression (e.g., low amplitude R waves in V1-V3).
- May mimic anterior infarction or lead to underestimation of R wave size.
|
- Can lead to misdiagnosis of myocardial infarction, particularly in the anterior wall.
- Essential to verify chest lead placement for accurate interpretation.
|
| Electrical Interference (e.g., Muscle Tremor, Artifact) |
- Baseline "noise" or irregular artifacts throughout the ECG tracing.
- Often appears as rapid, small-amplitude, irregular deflections.
|
- May obscure true ECG findings, making interpretation difficult or impossible.
- Important to ensure the patient is relaxed and equipment is properly grounded.
|
| Bundle Branch Block Masking Ischemia |
- Wide QRS complex (>0.12 sec), often with abnormal morphology in V1-V3 (RBBB) or V5-V6 (LBBB).
- ST-segment changes may be difficult to interpret due to bundle branch block pattern.
|
- Left bundle branch block (LBBB) can mask ST-elevation myocardial infarction (STEMI).
- Important to use additional criteria (e.g., Sgarbossa criteria) when assessing ischaemia in the presence of bundle branch blocks.
|
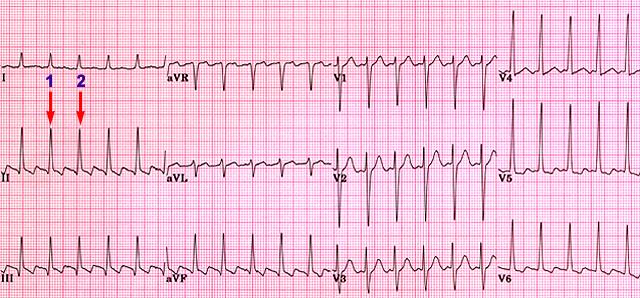
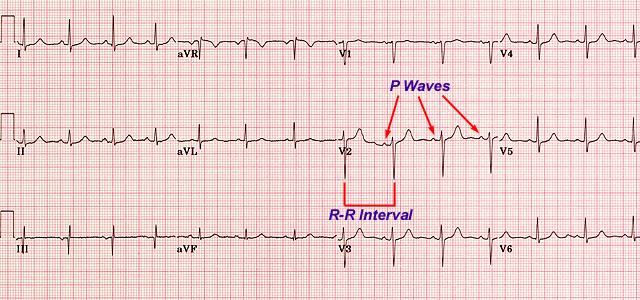
Locate a QRS complex that falls on a major grid line. Count large squares to the next QRS complex, then divide 300 by this number to calculate heart rate. There are several ways to do this
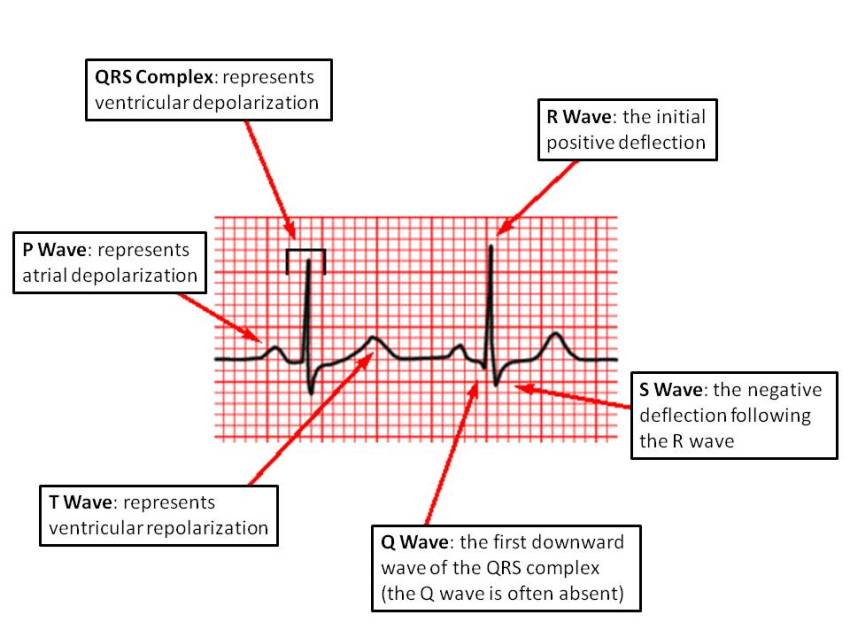
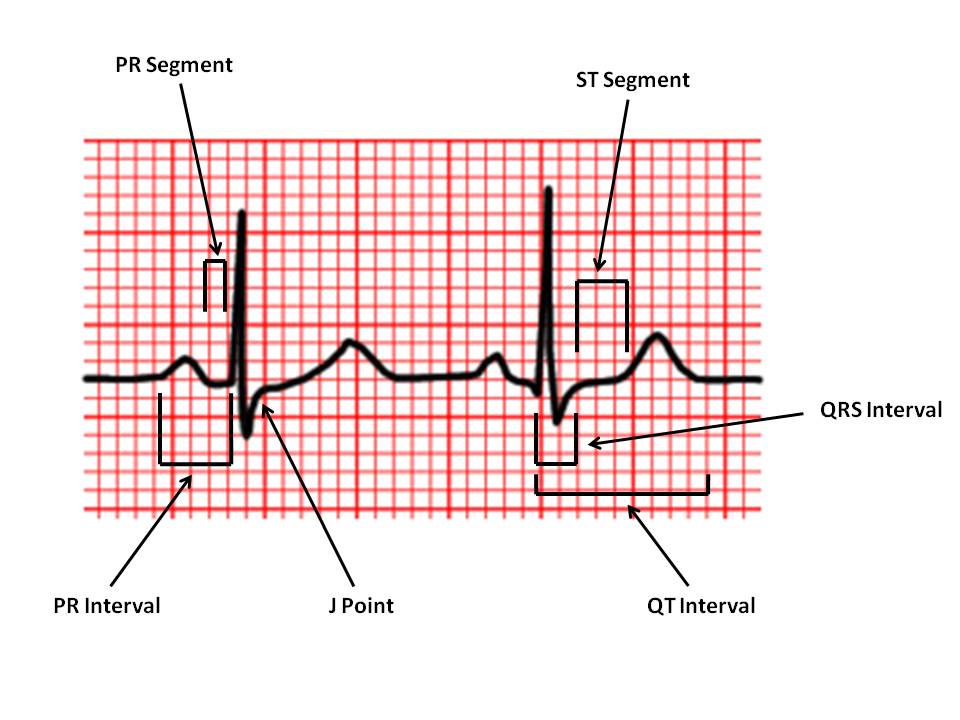
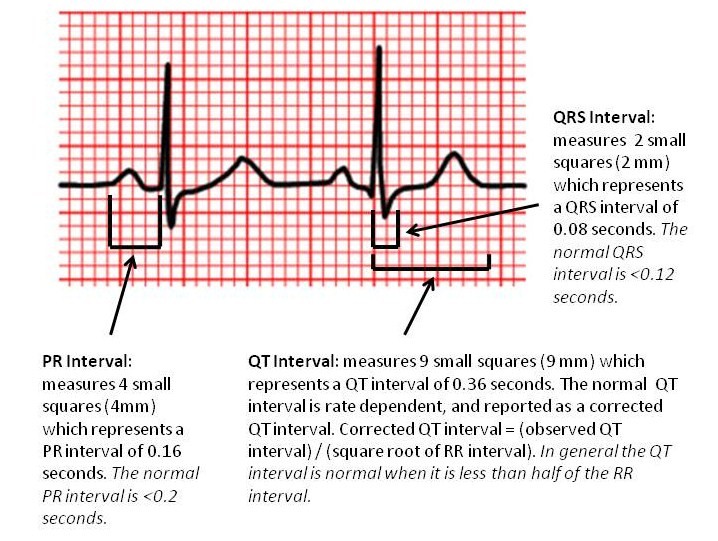
Measure the PR, QRS, and QT intervals. On a 25 mm/sec ECG, each small square represents 0.04 seconds, and each large square represents 0.2 seconds.
| Interval/Segment |
Normal Value |
Significance |
| PR Interval |
0.12 - 0.20 seconds (3-5 small squares) |
- Short PR Interval: May indicate Wolff-Parkinson-White (WPW) syndrome or Lown-Ganong-Levine (LGL) syndrome.
- Prolonged PR Interval: Suggests first-degree heart block.
|
| QRS Interval |
≤ 0.12 seconds (3 small squares) |
- Prolonged QRS Interval (> 0.12 sec): Indicates bundle branch block or ventricular origin of rhythm (e.g., ventricular tachycardia).
- May also suggest hypertrophy, scar tissue, or electrolyte imbalance.
|
| QT Interval |
< 0.40 seconds for males, < 0.44 seconds for females |
- Prolonged QT Interval: Associated with risk of torsades de pointes and sudden cardiac death; may be caused by medications, electrolyte disturbances, or congenital long QT syndrome.
- Short QT Interval: May indicate hypercalcemia or congenital short QT syndrome, both of which can lead to arrhythmias.
|
| ST Segment |
Should be isoelectric (flat) |
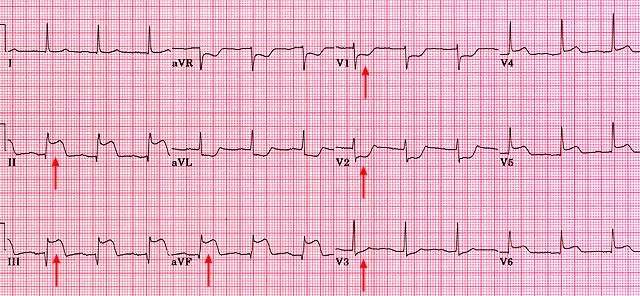
- ST Elevation: Suggests acute myocardial injury, seen in conditions like myocardial infarction or pericarditis.
- ST Depression: Indicates myocardial ischaemia, often seen in angina or demand ischaemia.
|
| J Point |
Junction between the end of QRS and start of ST segment |
- Elevation of J Point: Can be a normal finding (early repolarization) but may also suggest ischaemia or pericarditis if associated with other changes.
|
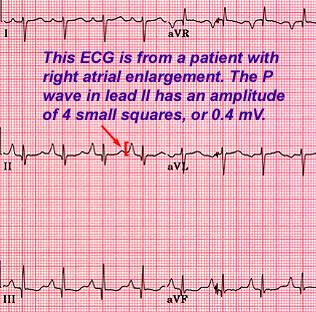
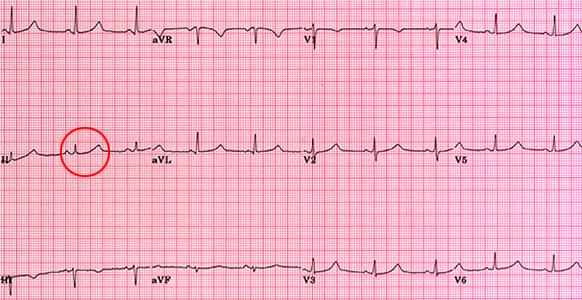
| P Wave Amplitude (Lead II) |
≤ 3 mm (0.3 mV) |
- Increased P Wave Amplitude: Suggests right atrial enlargement.
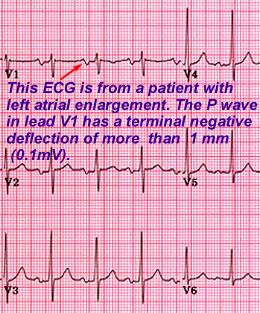
- Broad or Notched P Wave: Indicates left atrial enlargement.
|
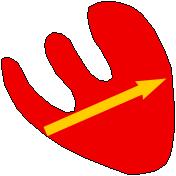
| Axis Type |
Lead I |
Lead aVF |
Angle Range |
Clinical Significance |
| Normal Axis |
Positive QRS |
Positive QRS |
0° to +90° |
- Indicates normal ventricular conduction and depolarization.
- Commonly seen in healthy individuals.
|
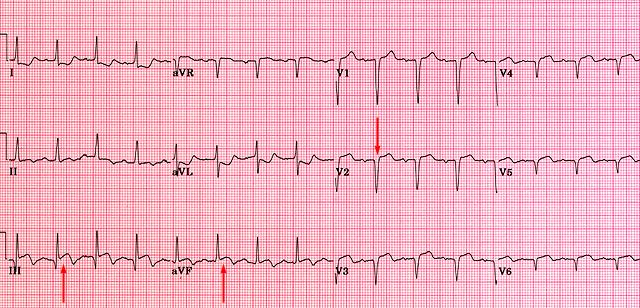
| Left Axis Deviation (LAD) |
Positive QRS |
Negative QRS |
-30° to -90° |
- May indicate left ventricular hypertrophy, often due to hypertension or aortic stenosis.
- Common in left anterior fascicular block and inferior myocardial infarction.
- Seen in conditions that shift the electrical activity toward the left side of the heart.
|
| Right Axis Deviation (RAD) |
Negative QRS |
Positive QRS |
+90° to +180° |
- Suggestive of right ventricular hypertrophy, often due to pulmonary hypertension, chronic lung disease, or congenital heart disease.
- Associated with right bundle branch block and left posterior fascicular block.
- Common in conditions with increased pressure or volume load on the right ventricle.
|
| Extreme Axis Deviation ("Northwest Axis") |
Negative QRS |
Negative QRS |
-90° to ±180° |
- Often indicates severe conduction abnormalities, such as ventricular rhythms or severe cardiomyopathy.
- Associated with ventricular tachycardia, advanced heart disease, or hyperkalemia.
- May suggest severe pathology requiring immediate attention.
|
Check if the rhythm is regular by confirming a consistent RR interval. Ensure there is a P wave before each QRS complex.
| Rhythm Type |
Key Clues on ECG |
Clinical Significance |
| Normal Sinus Rhythm (NSR) |
- Regular rhythm
- P wave before each QRS complex
- Normal PR interval (0.12-0.20 sec)
- Heart rate: 60-100 bpm
|
Indicates a healthy heart rhythm with normal electrical conduction. |
| Sinus Bradycardia |
- Regular rhythm
- P wave before each QRS complex
- Heart rate: < 60 bpm
|
- Can be normal in athletes or during sleep.
- May indicate hypothyroidism, increased vagal tone, or medication effects (e.g., beta-blockers).
- If symptomatic, may cause fatigue, dizziness, or syncope.
|
| Sinus Tachycardia |
- Regular rhythm
- P wave before each QRS complex
- Heart rate: > 100 bpm
|
- Common in response to fever, anxiety, pain, dehydration, or hypoxia.
- Persistent tachycardia may strain the heart over time.
|
| Atrial Fibrillation (AF) |
- Irregularly irregular rhythm
- Absence of distinct P waves
- Variable ventricular rate
|
- Increases risk of stroke and thromboembolism due to blood stasis in the atria.
- May cause palpitations, fatigue, and reduced cardiac output.
- Requires anticoagulation if risk factors for stroke are present.
|
| Atrial Flutter |
- Sawtooth atrial waves (flutter waves) typically at a rate of 250-350 bpm
- Regular or irregular ventricular response
|
- Can cause symptoms similar to AF and also increases stroke risk.
- Often treated with rate control, rhythm control, or ablation therapy.
|
| Ventricular Tachycardia (VT) |
- Wide QRS complexes (> 0.12 sec)
- Regular rhythm
- Heart rate: 100-250 bpm
|
- A life-threatening arrhythmia; may deteriorate into ventricular fibrillation.
- Often occurs in the setting of ischemic heart disease or electrolyte imbalances.
- Requires immediate intervention with antiarrhythmics or defibrillation.
|
| Ventricular Fibrillation (VF) |
- Chaotic, irregular rhythm
- No identifiable QRS complexes
|
- A medical emergency resulting in cardiac arrest.
- Immediate defibrillation and CPR are necessary for survival.
|
| First-Degree Heart Block |
- Prolonged PR interval (> 0.20 sec) but consistent with each beat
- Normal QRS complex
|
- Usually benign and asymptomatic.
- May be associated with aging, vagal tone, or certain medications.
|
| Second-Degree Heart Block (Mobitz Type I - Wenckebach) |
- Progressive lengthening of PR interval until a QRS is dropped
- Pattern then repeats
|
- Usually benign; may cause occasional symptoms like dizziness.
- Commonly seen in young, healthy individuals or with increased vagal tone.
|
| Second-Degree Heart Block (Mobitz Type II) |
- Consistent PR interval with intermittent dropped QRS complexes
- Can have a 2:1, 3:1, or variable conduction ratio
|
- More serious than Mobitz I and may progress to complete heart block.
- Often requires pacemaker insertion due to risk of sudden progression.
|
| Third-Degree Heart Block (Complete Heart Block) |
- No relationship between P waves and QRS complexes
- Atrial and ventricular rhythms are independent
- QRS rate often slow and regular
|
- Serious condition that requires immediate pacemaker insertion.
- Causes fatigue, syncope, and may lead to cardiac arrest.
|
| P Wave Type |
ECG Characteristics |
Clinical Significance |
| Normal P Wave |
- Upright in leads I, II, and aVF
- Duration < 0.12 seconds (3 small squares)
- Amplitude ≤ 3 mm (0.3 mV) in lead II
|
Indicates normal atrial depolarization. |
| Tall P Wave (P Pulmonale) |
- Amplitude > 3 mm (0.3 mV) in lead II
- Sharp, peaked appearance
|
- Associated with right atrial enlargement.
- Commonly seen in conditions causing right atrial overload, such as chronic obstructive pulmonary disease (COPD), pulmonary hypertension, and tricuspid stenosis.
|
| Broad P Wave (P Mitrale) |
- Duration > 0.12 seconds (3 small squares)
- Notched or "M-shaped" P wave in lead II
- Terminal negative deflection in lead V1
|
- Indicates left atrial enlargement.
- Seen in conditions causing left atrial overload, such as mitral stenosis, mitral regurgitation, and left ventricular hypertrophy.
|
| Biphasic P Wave |
- P wave has a positive and negative deflection, especially in lead V1
- Initial positive deflection with terminal negative deflection
|
- May indicate left atrial enlargement if the terminal portion of the P wave is larger and more prolonged.
- Common in atrial abnormalities or conditions affecting both atria.
|
| Absent P Wave |
- No visible P waves before QRS complexes
- Irregularly irregular rhythm (in atrial fibrillation)
|
- Commonly seen in atrial fibrillation, indicating loss of organized atrial activity.
- May also indicate sinoatrial block or junctional rhythms.
|
| Inverted P Wave |
- Inverted P waves in leads II, III, and aVF
- P wave may appear after the QRS complex in junctional rhythm
|
- Indicates retrograde atrial depolarization, often seen in junctional rhythms.
- May be due to ectopic atrial or junctional pacemaker.
|
| Sawtooth P Wave (Flutter Waves) |
- Regular sawtooth pattern, especially in leads II, III, and aVF
- Atrial rate of 250-350 bpm
|
- Characteristic of atrial flutter.
- Associated with increased risk of thromboembolism and requires rate control or rhythm management.
|
| Fibrillatory Waves (f Waves) |
- Irregular, small, wave-like deflections replacing P waves
- No consistent P waves; irregularly irregular rhythm
|
- Characteristic of atrial fibrillation.
- Indicates disorganized atrial activity with increased risk of stroke.
|
| QRS Complex Type |
ECG Characteristics |
Clinical Significance |
| Normal QRS Complex |
- Duration: ≤ 0.12 seconds (3 small squares)
- Amplitude: Typically ≥ 5 mm in limb leads and ≥ 10 mm in precordial leads
|
Indicates normal ventricular depolarization. |
| Left Ventricular Hypertrophy (LVH) |
- Tall R waves in leads V5, V6, and aVL
- Deep S waves in leads V1 and V2
- Voltage criteria: Sum of S wave in V1 or V2 + R wave in V5 or V6 ≥ 35 mm (3.5 mV)
- R wave in lead aVL ≥ 12 mm (1.2 mV)
|
- Suggests left ventricular hypertrophy, commonly due to hypertension, aortic stenosis, or hypertrophic cardiomyopathy.
- Associated with increased risk of cardiovascular events.
|
| Right Ventricular Hypertrophy (RVH) |
- Tall R wave in lead V1 (≥ 7 mm or R/S ratio ≥ 1 in V1)
- Right axis deviation (QRS axis > +90°)
- Deep S waves in leads I, V5, and V6
|
- Suggests right ventricular hypertrophy, commonly due to pulmonary hypertension, pulmonary valve stenosis, or chronic lung disease.
- Associated with conditions that increase pressure or volume load on the right ventricle.
|
| Low Voltage QRS |
- QRS amplitude < 5 mm in all limb leads
- QRS amplitude < 10 mm in all precordial leads
|
- May indicate conditions such as pericardial effusion, obesity, pulmonary disease, or hypothyroidism.
- Can also be due to myocardial damage or infiltrative diseases like amyloidosis.
|
| Bundle Branch Block (BBB) |
- Prolonged QRS duration (> 0.12 seconds)
- Right Bundle Branch Block (RBBB): RSR' pattern in V1 and V2 with wide S wave in leads I and V6
- Left Bundle Branch Block (LBBB): Broad, notched R waves in leads I, aVL, V5, and V6 with absence of Q waves in leads I and V6
|
- RBBB may be benign or associated with right heart strain or pulmonary disease.
- LBBB often indicates structural heart disease and may mask ischemic changes on ECG.
|
| Pathological Q Waves |
- Q wave duration ≥ 0.04 seconds and depth ≥ 25% of the R wave in the same lead
- Typically seen in contiguous leads, suggesting a myocardial infarction (e.g., leads V1-V4 for anterior MI)
|
- Indicates previous myocardial infarction and scar tissue formation.
- Q waves in contiguous leads suggest infarction in the corresponding myocardial region.
|
Pathological Q waves (≥ 0.04 seconds and > 1/3 R wave amplitude) suggest MI, especially if seen in multiple contiguous leads.
| Q Wave Type |
ECG Characteristics |
Clinical Significance |
| Normal Q Wave |
- Small Q waves present in certain leads (e.g., I, aVL, V5, V6)
- Duration < 0.04 seconds (1 small square)
- Amplitude < 25% of the R wave in the same lead
|
Represents normal septal depolarization, often seen in the lateral and inferior leads. |
| Pathological Q Wave |
- Duration ≥ 0.04 seconds (1 small square)
- Amplitude ≥ 25% of the R wave height in the same lead
- Typically seen in contiguous leads
|
- Indicates myocardial infarction (MI), especially if seen in contiguous leads.
- Signifies necrosis or scar tissue from previous MI.
- Suggests an old infarction in the corresponding myocardial territory (e.g., anterior, inferior, or lateral MI).
|
| Deep Q Waves |
- Q waves with greater depth, often exceeding 2-3 mm
- May be isolated to specific leads depending on infarct location
|
- Associated with significant myocardial damage from a previous large infarction.
- May indicate an old transmural (full-thickness) infarction.
|
| QS Complex |
- Entire QRS complex is a negative deflection (no R wave present)
- Often seen in leads overlying the infarcted area
|
- Indicates complete myocardial necrosis in that region.
- Commonly seen in an extensive anterior wall MI.
|
| Septal Q Waves |
- Small Q waves in leads I, aVL, V5, V6
- Duration < 0.04 seconds and amplitude < 25% of the R wave in the same lead
|
- Considered normal and due to normal septal depolarization.
- Not indicative of pathology.
|
| Isolated Q Waves in Lead III |
- Q wave present only in lead III
- Not present in contiguous leads
|
- Often a normal variant and not indicative of pathology.
- If isolated, does not usually suggest infarction.
|
ST elevation suggests myocardial injury, while depression can indicate ischaemia. T wave abnormalities may also signal pathology.
| Abnormality |
ECG Characteristics |
Potential Causes |
| ST Elevation |
- Elevated ST segment > 1 mm in limb leads or > 2 mm in precordial leads
- May be concave, convex, or "tombstone" shaped
|
- Acute Myocardial Infarction (MI): Especially if localized to contiguous leads.
- Pericarditis: Diffuse, concave ST elevation across multiple leads, often with PR depression.
- Prinzmetal’s (Variant) Angina: Transient ST elevation during vasospasm.
- Left Ventricular Aneurysm: Persistent ST elevation in leads where previous MI occurred.
|
| ST Depression |
- Depressed ST segment > 0.5 mm below baseline
- May be horizontal, downsloping, or upsloping
|
- Myocardial Ischemia: Often seen during exercise or stress testing.
- Hypokalemia: Can cause ST depression along with U waves.
- Posterior MI: ST depression in anterior leads (reciprocal changes for posterior infarction).
- Digoxin Effect: "Scooped" ST depression, also known as the "reverse tick" sign.
|
| Inverted T Waves |
- T waves are inverted or negative in leads where they would normally be positive (e.g., leads I, II, V3-V6)
|
- Myocardial Ischemia: Particularly if in contiguous leads and new or dynamic.
- Left Ventricular Hypertrophy (LVH): T wave inversion in leads with tall R waves (strain pattern).
- Bundle Branch Block (BBB): T wave inversions are often seen in leads associated with the block (e.g., V1-V3 in RBBB).
- Intracranial Hemorrhage: Widespread T wave inversion ("cerebral T waves").
|
| Tall Peaked T Waves |
- T wave amplitude > 5 mm in limb leads or > 10 mm in precordial leads
- Pointed, narrow T wave shape
|
- Hyperkalemia: Classic finding in hyperkalemia; severe cases may progress to sine-wave pattern.
- Acute MI: Early stages of MI can present with hyperacute T waves.
|
| Flat T Waves |
- T waves appear flattened or reduced in amplitude
|
- Hypokalemia: Often seen with ST depression and prominent U waves.
- Ischemia: Flattening of T waves may indicate myocardial ischaemia.
|
| U Waves |
- Small positive wave following the T wave, best seen in leads V2-V3
|
- Hypokalemia: U waves are prominent in low potassium states.
- Bradycardia: May cause appearance of U waves.
- Medications: Digitalis and certain antiarrhythmics may produce U waves.
|
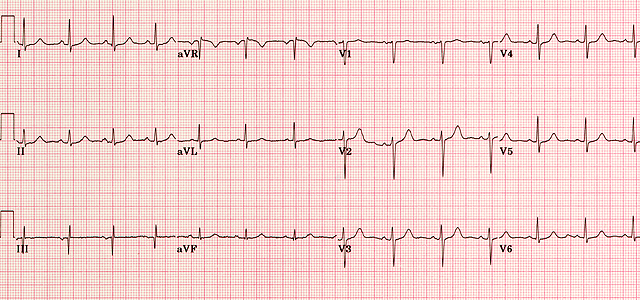
This ECG is from a male patient with familial prolonged QT syndrome. Normal QTC: ≤ 0.40 seconds for males; ≤ 0.44 seconds for females.
| QTc Abnormality |
ECG Characteristics |
Potential Causes |
Clinical Significance |
| Normal QTc |
- QTc < 0.44 seconds in males
- QTc < 0.46 seconds in females
|
- Normal physiological state with regular ventricular repolarization.
|
Indicates a low risk of ventricular arrhythmias. |
| Prolonged QTc |
- QTc > 0.44 seconds in males
- QTc > 0.46 seconds in females
|
- Medications: Antiarrhythmics, antidepressants, antipsychotics, and certain antibiotics (e.g., macrolides, fluoroquinolones)
- Electrolyte Imbalances: Hypokalemia, hypocalcemia, hypomagnesemia
- Genetic Conditions: Congenital long QT syndromes (e.g., LQT1, LQT2, LQT3)
- Acute Medical Conditions: Myocardial infarction, bradycardia, stroke
|
- Increased risk of torsades de pointes, a life-threatening ventricular arrhythmia.
- Patients with prolonged QTc should be monitored, especially when taking QT-prolonging drugs.
|
| Severely Prolonged QTc |
- QTc > 0.50 seconds in either gender
|
- Often associated with congenital long QT syndrome or severe electrolyte imbalance.
- High-dose or combination QT-prolonging drugs.
- Advanced cardiac disease or ischaemia.
|
- High risk of torsades de pointes and sudden cardiac death.
- Immediate intervention may be necessary to correct underlying causes.
|
| Shortened QTc |
|
- Hypercalcemia: Elevated calcium levels shorten the QT interval.
- Genetic Short QT Syndrome: Rare congenital condition with high arrhythmic risk.
- Hyperkalemia: Increased potassium levels may lead to QT shortening.
- Medications: Digitalis can shorten the QT interval.
|
- Increased risk of atrial and ventricular arrhythmias.
- Patients with significantly short QTc should be evaluated for genetic conditions and monitored for arrhythmic events.
|
This module was developed by Adam Szulewski, edited by Dr. Bob McGraw, Dr. Jason and has been heavily edited and added to.
