Makindo Medical Notes"One small step for man, one large step for Makindo" |
|
|---|---|
| Download all this content in the Apps now Android App and Apple iPhone/Pad App | |
| MEDICAL DISCLAIMER: The contents are under continuing development and improvements and despite all efforts may contain errors of omission or fact. This is not to be used for the assessment, diagnosis, or management of patients. It should not be regarded as medical advice by healthcare workers or laypeople. It is for educational purposes only. Please adhere to your local protocols. Use the BNF for drug information. If you are unwell please seek urgent healthcare advice. If you do not accept this then please do not use the website. Makindo Ltd. |
ECG - Interpretation
-
| About | Anaesthetics and Critical Care | Anatomy | Biochemistry | Cardiology | Clinical Cases | CompSci | Crib | Dermatology | Differentials | Drugs | ENT | Electrocardiogram | Embryology | Emergency Medicine | Endocrinology | Ethics | Foundation Doctors | Gastroenterology | General Information | General Practice | Genetics | Geriatric Medicine | Guidelines | Haematology | Hepatology | Immunology | Infectious Diseases | Infographic | Investigations | Lists | Microbiology | Miscellaneous | Nephrology | Neuroanatomy | Neurology | Nutrition | OSCE | Obstetrics Gynaecology | Oncology | Ophthalmology | Oral Medicine and Dentistry | Paediatrics | Palliative | Pathology | Pharmacology | Physiology | Procedures | Psychiatry | Radiology | Respiratory | Resuscitation | Rheumatology | Statistics and Research | Stroke | Surgery | Toxicology | Trauma and Orthopaedics | Twitter | Urology
Related Subjects: |ECG Basics |ECG Axis |ECG Analysis |ECG LAD |ECG RAD |ECG Low voltage |ECG Pathological Q waves |ECG ST/T wave changes |ECG LBBB |ECG RBBB |ECG short PR |ECG Heart Block |ECG Asystole and P wave asystole |ECG QRS complex |ECG ST segment |ECG: QT interval |ECG: LVH |ECG RVH |ECG: Bundle branch blocks |ECG Dominant R wave in V1 |ECG Acute Coronary Syndrome |ECG Narrow complex tachycardia |ECG Ventricular fibrillation |ECG Regular Broad complex tachycardia |ECG Crib sheets |ECG Errors
One needs to connect 10 wires to do a "12 lead ECG". "Leads" in this context means electrical views of the heart.
Summary
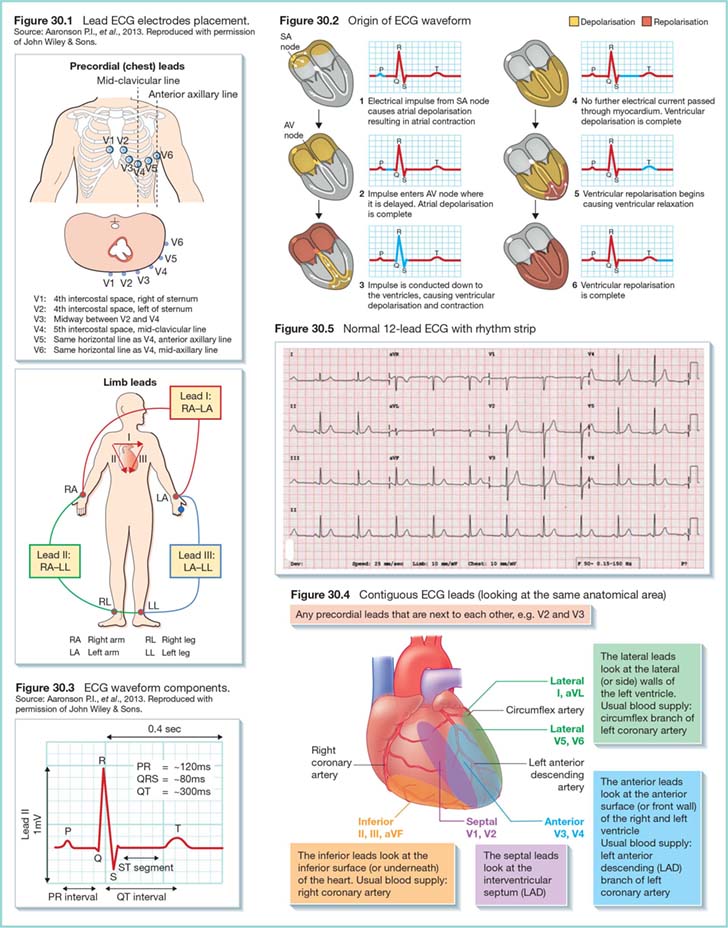
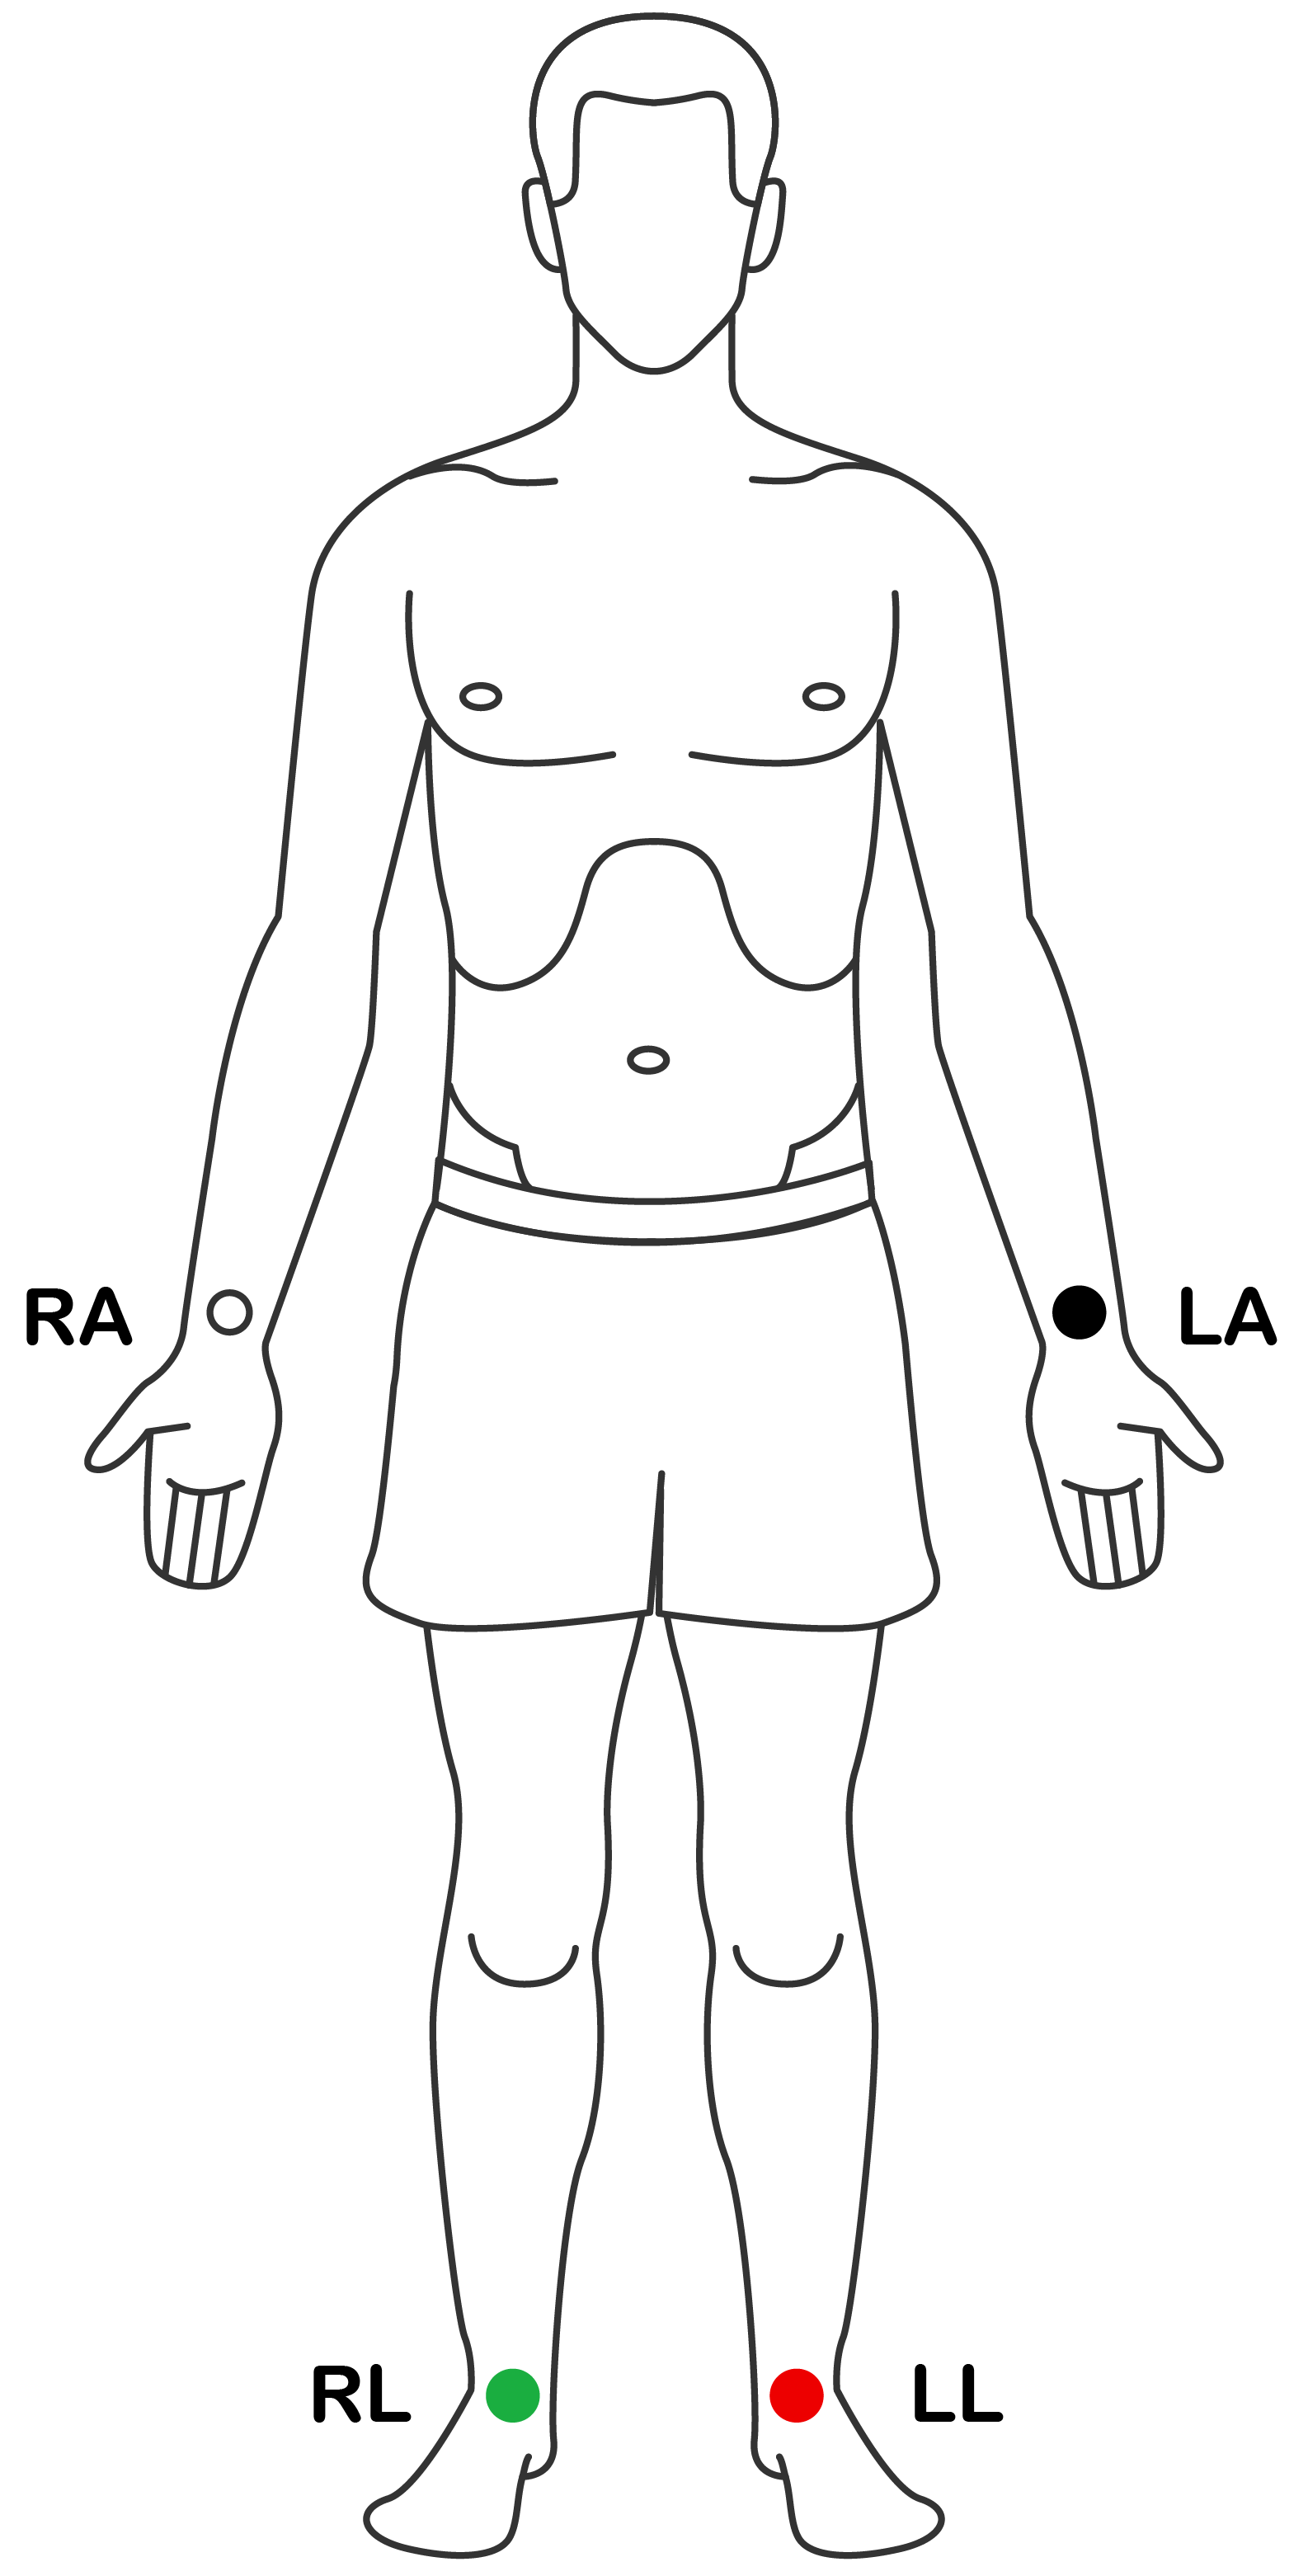
Limb leads
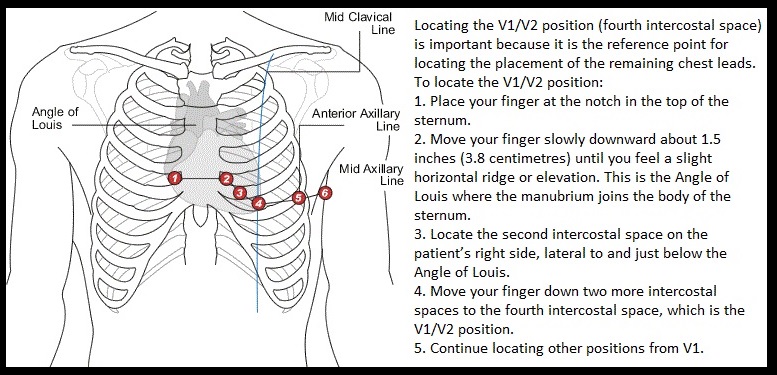
Left sided chest leads
 VF
VF
About
- The ECG picks up the difference in the potential difference between two surface points. It can pick up cardiac electrical changes.
- Now done using 10 electrical leads which attach to the patient (6 chest and 4 limb) which gives 12 electrical views of the heart confusingly also called "leads".
- An ECG is basically a collection of graphs of surface potential difference between two points measured in millivolts on the y axis and time on the X-axis. Vertically 10 mm = 1 mV. Horizontally 25 mm = one second.
- Be careful to check this as sometimes an ECG has been calibrated with a vertical scale of 20mm = 1 mV which automatically doubles the height of the ECG. On the left of any ECG are calibration spikes that should be 1 cm (10mm) high.
- Please note that V1 and V2 are not in the 2nd space but the 4th space. Do not confuse V1 and V2 with the aortic and pulmonary areas for auscultation.
- Limb leads - are reconstructed to generate leads I,II,III,aVr,aVl,aVF
- Right arm
- Left arm
- Left leg
- Right leg (earth)
- Can be used to generate
- Lead I: is between the right arm and left arm electrodes, the left arm being positive.
- Lead II: is between the right arm and left leg electrodes, the left leg being positive.
- Lead III: is between the left arm and left leg electrodes, the left leg again being positive.
- aVR:Augmented leads
- aVL:Augmented leads
- aVF:Augmented leads
| Chest Leads | |
|---|---|
| V1 | Fourth intercostal space, right sternal border |
| V2 | Fourth intercostal space, left sternal border. |
| V3 | Midway between V2 and V4 |
| V4 | Fifth intercostal space, left midclavicular line |
| V5 | Level with V4, left anterior axillary line |
| V6 | Level with V4, left mid axillary line |
| Limb leads | |
| Right Arm | usually over wrist |
| Left Arm | usually over wrist |
| Right leg (earth) | over ankle |
| Left leg | over ankle |
Axis of leads
- I : Left arm to right arm : 0 degrees
- II: Left leg to right arm : 60 degrees
- III: Left leg to left arm : 120 degrees
- aVL : left arm to all other leads : -30 degrees
- aVR: Right arm to all other leads : - 150 degrees
- aVF: Left leg to all other leads : 90 degrees
a = augmented
Notes over lead orientation
- II, III, aVF = Inferior leads
- V1-V2 = Septal leads according to Braunwald
- V1-V6 = Anterior leads
- I, aVL, V5, V6 = Lateral leads
Process of ECG analysis
The electrocardiogram (ECG) is a crucial tool in diagnosing and monitoring cardiac conditions. It records the electrical activity of the heart and provides valuable information about heart rhythm, rate, and underlying cardiac pathology. Proper ECG interpretation is essential for timely diagnosis and management of patients with cardiac issues.
Components of the ECG
Each ECG cycle consists of several key components that reflect the different phases of the heart's electrical activity:
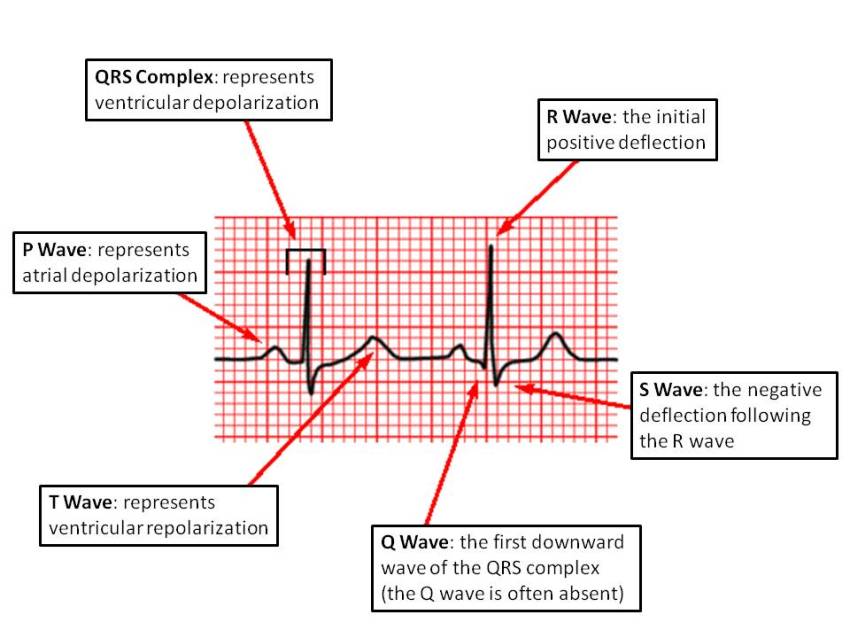
- P wave: Represents atrial depolarization (activation of the atria).
- PR interval: The time from the onset of atrial depolarization (P wave) to the onset of ventricular depolarization (QRS complex). Normal range: 120-200 ms (0.12-0.20 seconds).
- QRS complex: Represents ventricular depolarization (activation of the ventricles). Normal duration: less than 120 ms (0.12 seconds).
- ST segment: Represents the early part of ventricular repolarization. It is usually isoelectric (flat).
- T wave: Represents ventricular repolarization (restoration of electrical activity in the ventricles).
- QT interval: The time from the start of ventricular depolarization (QRS complex) to the end of ventricular repolarization (T wave). A normal QT interval is usually less than 440 ms.
Steps in ECG Interpretation
Follow these steps for a systematic approach to interpreting an ECG:
Rate
The heart rate can be calculated by counting the number of large squares between two consecutive R waves and dividing this number into 300. For example, if there are 3 large squares between two R waves, the heart rate is approximately 100 beats per minute (bpm) (300/3 = 100).
Rhythm
Assess the rhythm by examining the regularity of the R-R intervals:
- If the R-R intervals are consistent, the rhythm is regular.
- If the intervals vary, the rhythm is irregular. Atrial fibrillation is a common cause of irregularly irregular rhythm.
Axis
The cardiac axis can be determined by examining leads I, II, and aVF. A normal axis shows positive deflections in both leads I and aVF. Axis deviation may indicate underlying pathology:
- Left axis deviation: Commonly seen in left ventricular hypertrophy or inferior myocardial infarction.
- Right axis deviation: Seen in conditions such as right ventricular hypertrophy or pulmonary embolism.
P Waves
Check for the presence, shape, and consistency of P waves:
- Absent P waves suggest atrial fibrillation.
- P wave abnormalities (e.g., peaked or notched) may indicate atrial enlargement or conduction abnormalities.
PR Interval
Measure the PR interval to assess atrioventricular (AV) conduction:
- Normal PR interval: 120-200 ms (0.12-0.20 seconds).
- Prolonged PR interval: Indicates first-degree heart block.
QRS Complex
Evaluate the width and morphology of the QRS complex:
- Normal QRS duration: Less than 120 ms.
- Wide QRS complex: May indicate a bundle branch block, ventricular ectopic beats, or ventricular tachycardia.
- Pathological Q waves: May indicate previous myocardial infarction (Q waves >40 ms in duration and >2 mm deep).
ST Segment
Examine the ST segment for elevation or depression:
- ST elevation: Suggests acute myocardial infarction (STEMI).
- ST depression: Suggests ischaemia, subendocardial infarction, or digoxin effect.
T Waves
Assess T wave morphology:
- T wave inversion may indicate ischaemia or myocardial infarction.
- Peaked T waves are seen in hyperkalemia.
QT Interval
The QT interval should be measured and corrected for heart rate (QTc). A prolonged QT interval can increase the risk of arrhythmias like Torsades de Pointes. Normal QTc is usually less than 440 ms.
Common ECG Abnormalities
| Condition | ECG Findings |
|---|---|
| Atrial Fibrillation |
- Irregularly irregular rhythm
- Absence of distinct P waves - Narrow QRS complexes |
| Myocardial Infarction (STEMI) |
- ST segment elevation in two or more contiguous leads
- Pathological Q waves may develop later - T wave inversion after the acute phase |
| Left Bundle Branch Block (LBBB) |
- Wide QRS complexes (>120 ms)
- Absence of Q waves in leads I, V5, V6 - Broad notched or slurred R waves |
| Right Bundle Branch Block (RBBB) |
- Wide QRS complexes
- rsR' pattern (M-shaped QRS) in lead V1 - Wide slurred S wave in lead I and V6 |
| Hyperkalemia |
- Peaked T waves
- Widened QRS complex - Flattened P waves or absence of P waves in severe cases |
| Hypokalemia |
- Flattened or inverted T waves
- U waves (positive deflection after the T wave) - Prolonged QT interval |
5. Conclusion
ECG interpretation is a critical skill for doctors. A systematic approach involving the assessment of rate, rhythm, axis, waveforms, and intervals helps in identifying normal findings as well as diagnosing life-threatening conditions such as myocardial infarction, arrhythmias, and electrolyte imbalances. Consistent practice and pattern recognition are key to mastering ECG interpretation.
Characteristics
| PR Interval: |
From the start of the P wave to the start of the QRS complex |
| PR Segment: |
From the end of the P wave to the start of the QRS complex |
| J Point: |
The junction between the QRS complex and the ST segment |
| QT Interval: | From the start of the QRS complex to the end of the T wave |
| QRS Interval: | From the start to the end of the QRS complex |
| ST Segment: | From the end of the QRS complex (J point) to the start of the T wave |
Analysis
Axis
- X axis: Time at 25 mm/second: 1mm (small square) = 0.04 seconds 5mm (big square) = 0.2 sec
- Y axis: Millivolts: 1 mv = 1 cm unless the settings are changed e.g. 1 mV = 2cm. Always check calibration spike at beginning of reading
Rate
- Normal: Rate = 300 / number of large squares in between each consecutive R wave.
- Tachycardia: Rate = 1500 / number of small squares in between each consecutive R wave.
- Slow: Rate = number of complexes on the rhythm strip x 6 (this gives the average rate over a ten-second period).
 Normal ECG
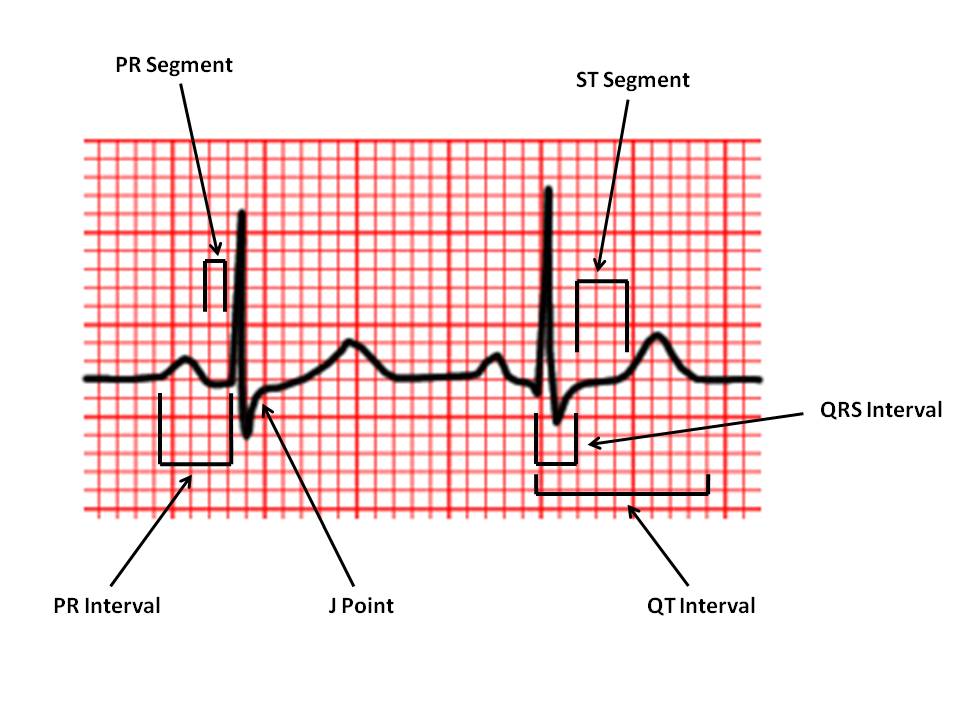 Normal ECG
Definition of Rates
- 60-100 beats/min: Normal
- >100 beats/min: Tachycardia
- <60 beats/min: Bradycardia
P waves
- The P wave is due to the depolarization of the atria. The wave of depolarization spreads from the right atrium to the left atrium. The P wave is therefore composed of the right atrial depolarization followed by that of the left.
- In normal practice happen so close that peaks cannot be differentiated easily. The entire P wave lasts less than 110 ms. The P wave is best seen in leads II and V1
- Upright in leads I, aVF and V3 - V6
- Normal duration of less than or equal to 0.11 seconds
- Polarity is positive in leads I, II, aVF and V4 - V6
- Diphasic in leads V1 and V3; negative in aVR
- Shape is generally smooth, not notched or peaked
- Pathological
- Left atrial enlargement causes a "P mitrale" - with a bifid waveform. It may be seen best in lead II and may be due to mitral stenosis, systemic hypertension, valvular disease and cardiomyopathy.
- Right atrial enlargement causes a "P pulmonale" - with a tall peaked P wave in lead II >2.5 mm and positive in lead V1. Seen in COPD and pulmonary hypertension. There is a poor correlation poor between RA enlargement and P pulmonale.
- Ectopic P wave where morphology differs with altered P wave axis. May be seen with what is called a coronary sinus rhythm. Occasionally associated with sinoatrial disease or ASD.
- Absent P wave - Atrial fibrillation, Junctional rhythm, Sinoatrial block
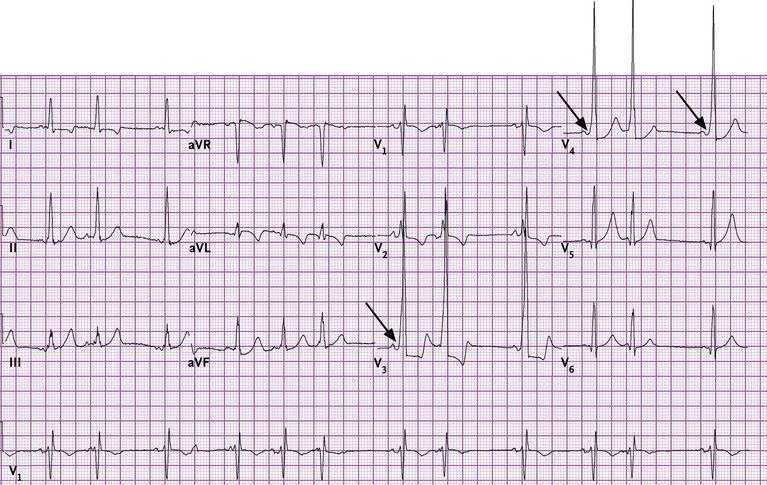
PR interval: normally between 0.12 and 0.2 seconds
- PR interval is caused electrically by passage of the action potential from
- Sinus Node to Atria: PA interval
- Atria to His bundle: AH interval
- His bundle to Ventricle: HV interval
- PR interval < 0.12 seconds
- Causes are usually pre-excitation when the ventricular is depolarised by an accessory pathway
- Wolff Parkinson white syndrome with a delta wave
- Lown Ganong Levin syndrome
- Ventricular ectopic immediately after p wave
- Low atrial rhythm
- Coronary sinus escape rhythm
- PR interval >0.2 seconds
- This is first degree heart block
- Usually asymptomatic but suggests conduction tissue disease
- Causes are usually pre-excitation when the ventricular is depolarised by an accessory pathway
QRS complex
- The first negative deflection is a Q wave and the next positive deflection is an R wave
- If a negative deflection occurs after an R wave it is called an S wave
- If the first defection is positive it is called an R wave, if there is an S wave and then a 2nd positive wave this is called an R' wave
- An RSR' pattern in V1 in RBBB - the left ventricle depolarized first followed by the right ventricle
- An RSR' pattern in V6 is LBBB - the right ventricle depolarized first then the left ventricle
- There is widening and coarsening of the QRS complex with severe hyperkalaemia
- Duration less than or equal to 0.12 seconds, amplitude greater than 0.5 mV in at least one standard lead, and greater than 1.0 mV in at least one precordial lead. The upper limit of normal amplitude is 2.5 - 3.0 mV. small septal Q waves in I, aVL, V5 and V6 (duration less than or equal to 0.04 seconds; amplitude less than 1/3 of the amplitude of the R wave in the same lead).
- Represented by a positive deflection with a large, upright R in leads I, II, V4 - V6 and a negative deflection with a large, deep S in aVR, V1 and V2 in general, proceeding from V1 to V6, the R waves get taller while the S waves get smaller. At V3 or V4, these waves are usually equal. This is called the transitional zone.
- Wide QRS >0.12 seconds (3 small squares)
- Ventricular initiation of complex
- Wolff Parkinson White syndrome
- Intraventricular conduction defect - LBBB, RBBB
- Hyperkalaemia
- Increased QRS voltage (height)
- LVH S in V1 and R in V5/6 >35 mm
- RVH Dominant R wave in V1
- Hypertropic cardiomyopathy
- Decreased QRS voltage (height)
- Obesity
- Pericardial fluid
- Hypothyroidism
- Emphysema
- QRS axis
- Reflects net direction vector of ventricular depolarisation
- Reflects muscle bulk and state of conduction pathways
- Normal vector is between -30 to + 120 degrees. Zero is horizontal and points left.
- Simply sum the net deflections of the ECG in lead I,II and III at 0, 60, 120 degrees
- The axis is at right angles to any lead where the net value is 0 but then need to calculate vector direction
- If lead I is positive then the vector points left. if lead II then is negative then LAD
- If lead I is negative then the vector points right. if lead II then is negative then LAD
Normal Q wave
- Normally represents left to right septal depolarization seen in left-sided leads
- Normal < 2.5 mV (2.5 mm) in height and less than 1 mm (small square) wide
- Pathological Q wave
- Pathological represents opposite R wave due to an electrical window caused by transmural infarction. It represents depolarisation away from the electrode of the opposing ventricular myocardium. Normal depolarisation passes from the internal endocardial surface to the external epicardial surface.
- The lead with the Q wave usually identifies the territory damaged and the artery involved. They are usually deep and >2.5 mm and often >1 mm wide. Pathological Q waves can also be seen with LVH usually associated with hypertrophy and large R waves or occasionally in hypertrophic cardiomyopathy.
- Where transmural infarction is incomplete the ECG marker is a loss of R wave height rather than the development of Q waves. This may be seen in the anterior leads as poor R wave progression. If there are additional T wave changes this is more indicative of previous infarction.
- A list of Causes of Pathological Q wave
- Transmural infarction
- Left ventricular hypertrophy
- HOCM
- Myocarditis
- Dilated cardiomyopathy
- Hyperkalaemia
- Infiltrative muscle disease
ECG - ST Segment
- Definition
- ST segment from ventricular depolarisation to repolarisation
- ST Elevation
- Myocardial infarction >1 mm in 2 contiguous chest leads or 1 mm in 2 limb leads
- Myocardial ischaemia - reciprocal
- Myocarditis/Pericarditis - saddle shaped concave upwards in all leads except aVR
- LBBB/LVH in V1/2
- Brugada syndrome
- Coronary artery spasm - Printzmetal's angina
- Left ventricular aneurysm
- ST Depression
- Left ventricular Hypertrophy and strain pattern
- Ischemia (typically best lead is V5 and 1-2 mm depression is significant). Downgoing >Flat >Upgoing in terms of significance
- Digoxin - reversed tick
- Hypokalaemia
- Changes with STEMI
- Hyperacute T waves
- ST elevation
- T wave inversion
- Loss of R wave height
- Q waves develop
ECG - T waves
- Definition
- The T wave is caused by ventricular repolarisation
- Abnormalities
- Peaked T waves are seen classically in hyperkalaemia
- Are generally in opposite polarity to the QRS complex
- Amplitude can be altered in hypothyroidism - "low voltage" also seen in an obese person and in those with COPD
Differentials
| QRS | Description |
|---|---|
| Heart rate | 60 - 100 bpm |
| PR interval | 0.12 - 0.20 s |
| QRS interval | = 0.12 s |
| QT interval | < half RR interval (males < 0.40 s; females < 0.44 s) |
| P wave amplitude (in lead II) | = 3 mV (mm) |
| P wave terminal negative deflection (in lead V1) | = 1 mV (mm) |
| Q wave | < 0.04 s (1 mm) and < 1/3 of R wave amplitude in the same lead |